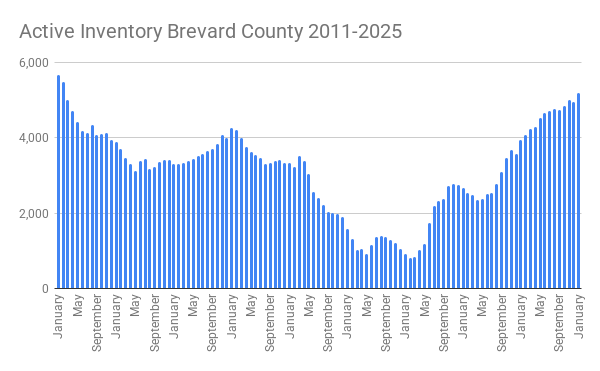
2025 is starting off with new highs and lows from the get-go! It’s going to be an interesting year. As you know, our active inventory has been steadily climbing the last few years. Our January inventory is 5,180 which is up 30% over 2024. This is the highest our inventory has been since February 2011. (I wish I tracked active inventory during the 2008-2010 to see how we compare to that turbulent market)
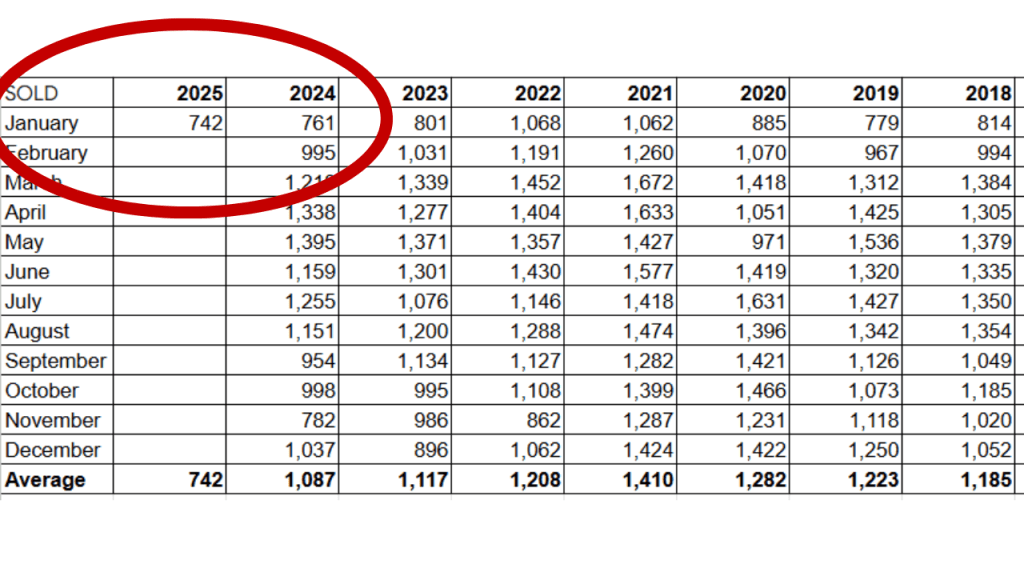
Sales in January & February are traditionally the slowest 2 months of the year. This January we had 742 sales, slightly behind January 2024’s 761 sales. This is one of the slowest months for closings since February 2012. We will not have a really good insight into what 2025 is bringing us in the real estate market until we get through March and April’s sales.
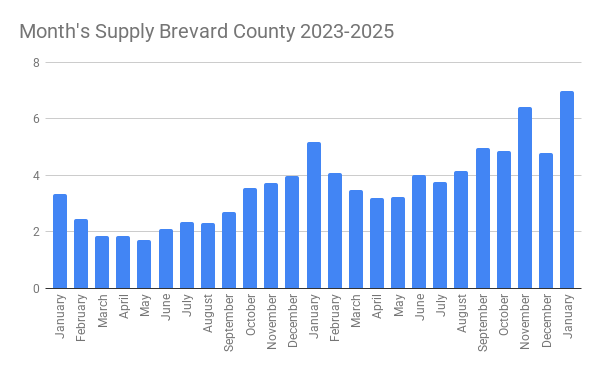
The higher inventory and lower transactions closing are causing our monthly supply of properties to rise. We are just under a 7 months supply of properties on the market. What this means is if we do not have any new properties come on the market and we continue selling 742 properties per month, we will be out of real estate in 7 months. It’s been since February 2011 that we have had a higher monthly supply of properties for sale.
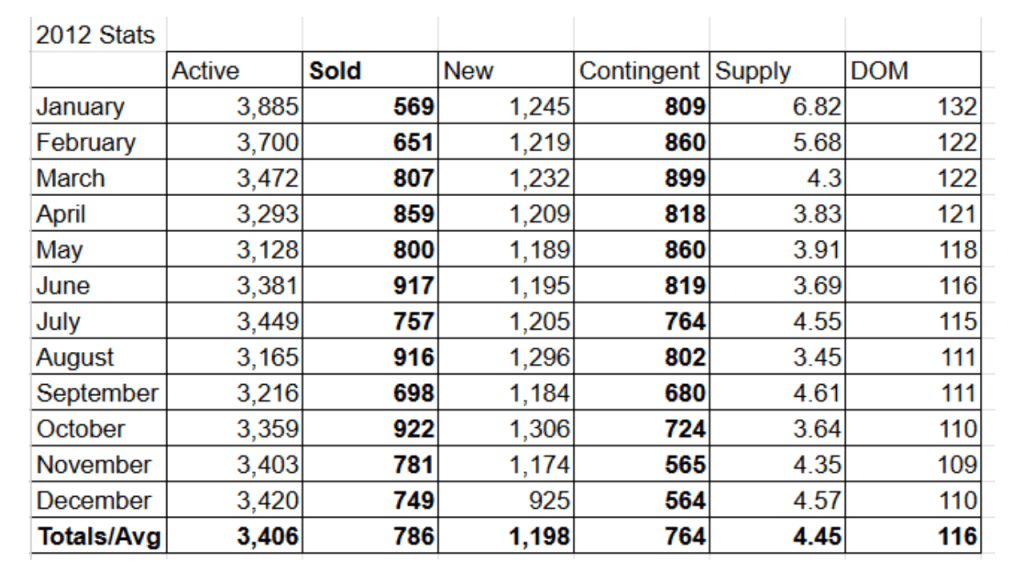
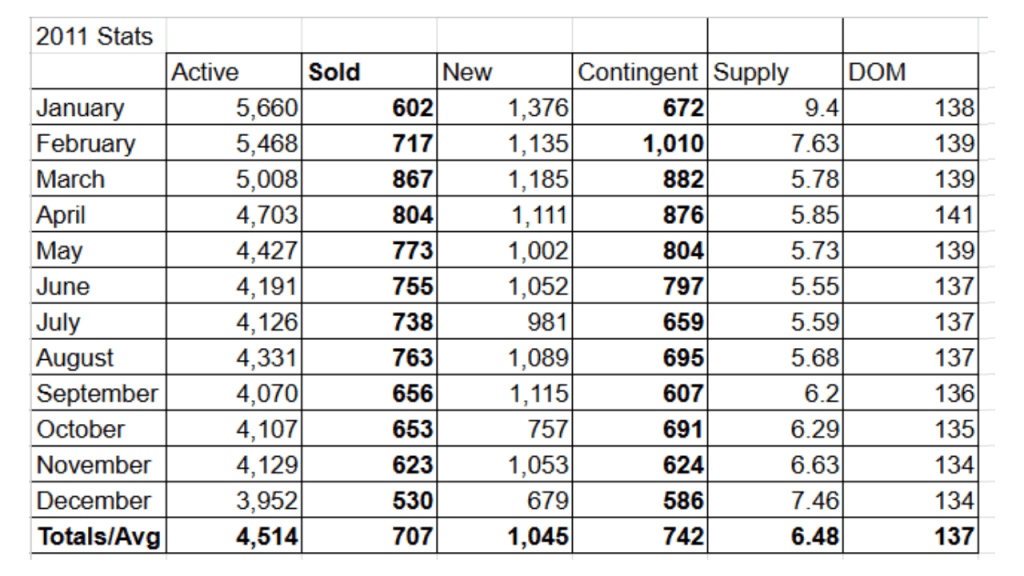
The time it takes a property to sell is taking longer too. The good news is that we are still selling properties quicker than we did in 2011 & 2012…for now. January Days On Market average was 75.67 DOM. This is up 34% from last January. This is an average and not all properties take 2.5 months to sell. There were over 100 sales that took 150 days or longer! There were also 261 properties to sell in the first 30 days (35%) and 112 that sold in 7 days or less (15%) Sellers, please be aware that the price you list your home from the beginning will determine if you are part of the 35% that will sell in 30 days.
If you were selling, and you didn’t get the showings or offers, you will more than likely fall into the “price change” statistics. I’ve only been keeping up with price changes the last few years, and there are certainly more of them happening in the last 12 months than were happening in 2021. Having to adjust your list price is a good thing to do if you are not getting showings and if there aren’t any offers coming in. If you are getting regular showings, you are probably within 3%-5% of where the list price needs to be. If your property is not being shown at all (have you had a showing in the last 7 days?) you are at least 5% too high…maybe even 10% overpriced. Looking at the price changes for January, they were pretty high…1,925 price changes. Certainly not the highest we have seen in the last 12 months though.
Brevard County
Active inventory 5180
Sold Property 742
Months Supply 6.98 months
Average Price $452,737 2024 $460,749
Median Price $363,000 2024 $395,000
List/Sale ratio 91%
Average price per SqFt $233.33 SqFt
Days On Market 75.67 DOM
Property selling in less than 7 days 110 ( 15% of the sales)
Property selling over $1M 35
Highest price sale $3.805M
Home sales under $200K 24
Cocoa Beach & Cape Canaveral
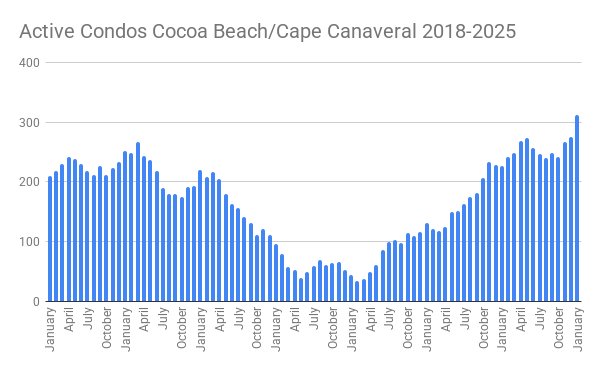
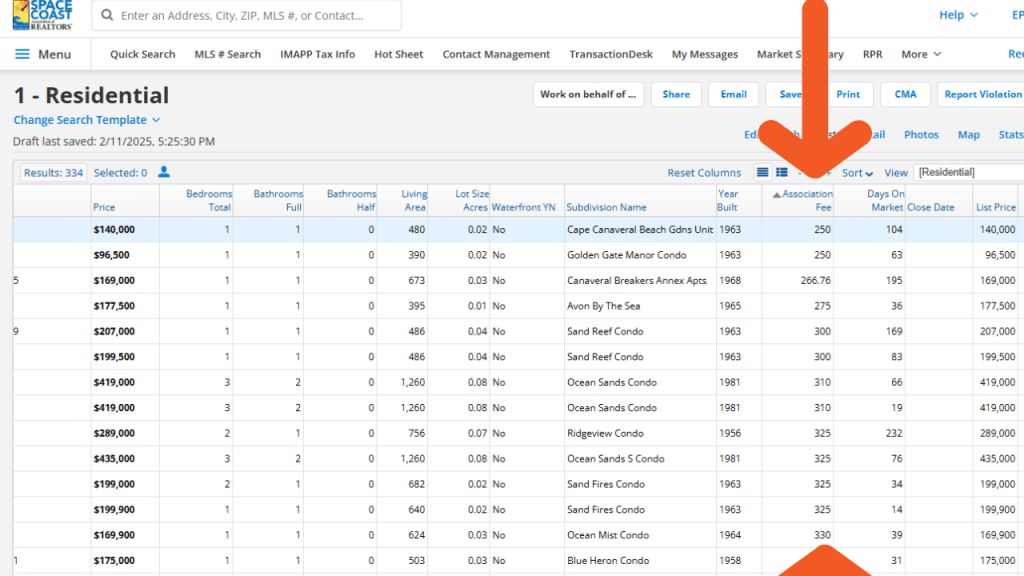
Here is what’s happening in our Cocoa Beach & Cape Canaveral market. The condo market is in pretty rough shape. Inventory is higher than I have ever seen it. We are now over 300 condos for sale with 312 available in the Cocoa Beach & Cape Canaveral area.
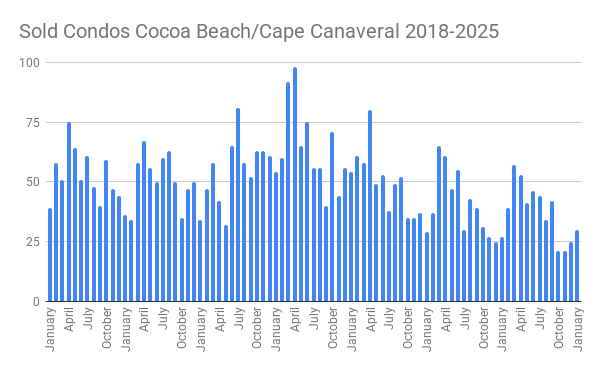
Condo sales have been slow but January was slightly better than the last few months with 30 closings. Really, this past January was the best January we have seen in the last few years. We sold 27 in 2024 and 29 in 2023. I know it’s not much of an increase, but I’ll take it as a plus!
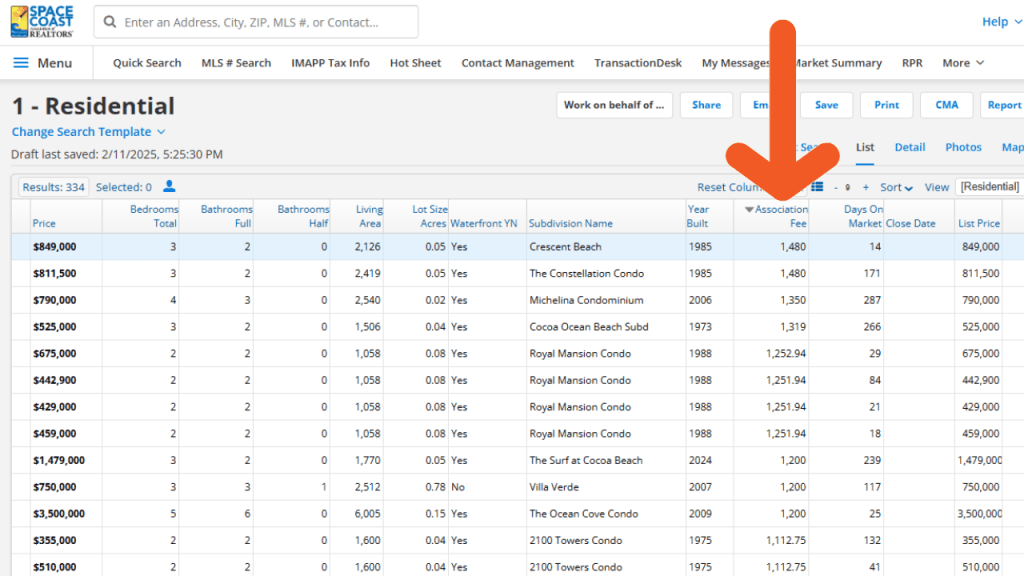
The tough thing with condos is the unknowns. What is happening with the monthly association fees? Are they ever going to stop going up? Right now, there are more condos on the market with condo dues $800 or higher than under $500. Part of the higher fees are from the insurance rates going. The other factor that is raising condo fees is the requirement to have the reserves 100% funded by the end of 2025. Fortunately, the increase for the reserve funding should be temporary if they can become 100% funded by year’s end. Some associations have to do special assessments just to get the money into reserves for the long term maintenance items.
The other issues with condos in Florida, especially in Cocoa Beach & Cape Canaveral (and every other beach town) are the milestone integrity inspections, the looming threat of concrete restoration, and the special assessments that will be needed to correct these issues. Concrete work is not cheap and it is an inconvenience living in the condo while the work is being done. A small job could cost the association $1,000,000. If there are 100 condos, this is a $10,000 assessment for each owner. This is a lot of money to come up with & the crazy thing is a $10K special assessment is on the low end.
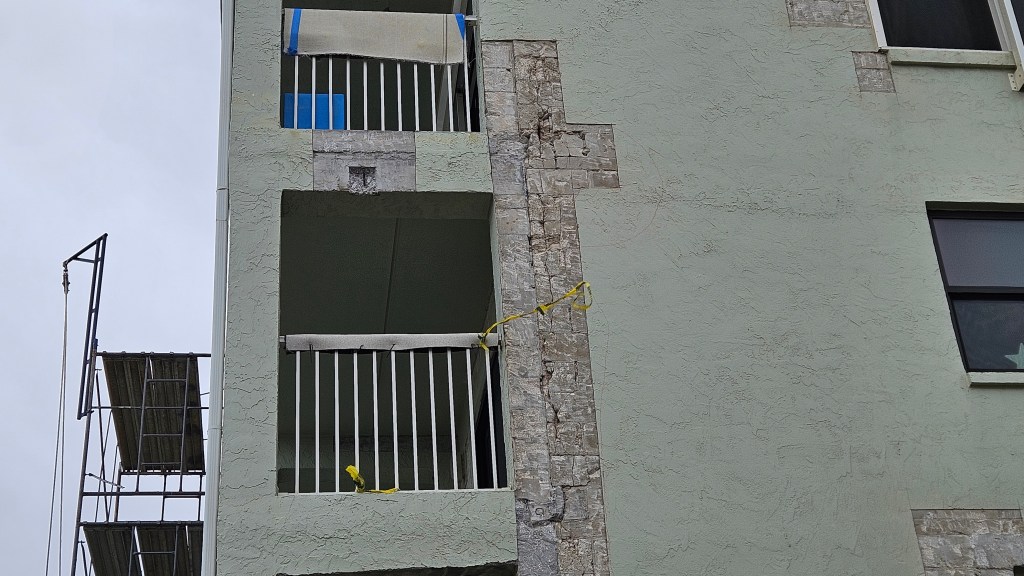
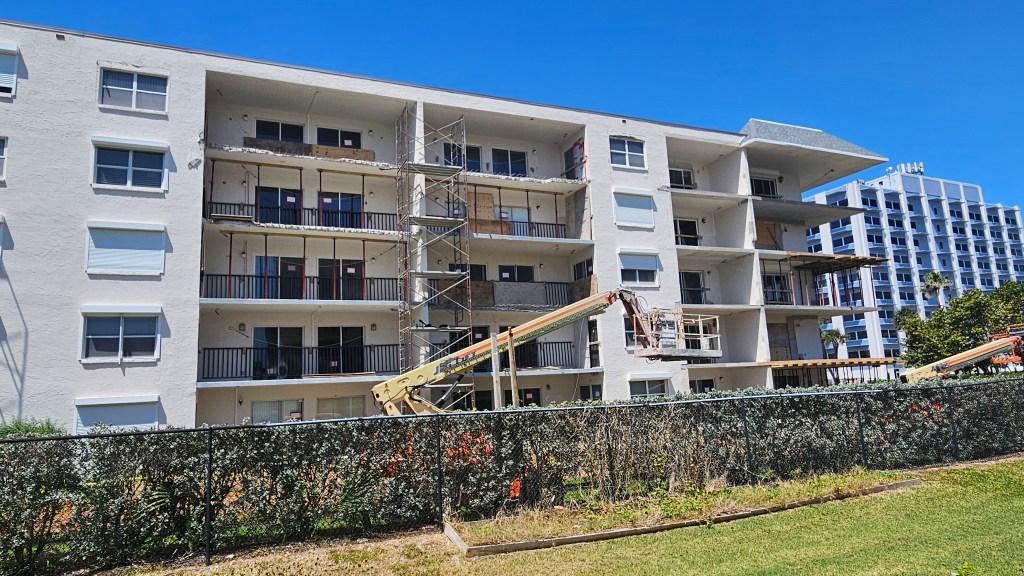
To make matters worse, if someone wants to get financing for a purchase, they might not be able to get the loan. The lender will want to review the milestone integrity inspection and if they deem any of the work as a safety issue, you will not be able to get traditional financing. This will limit condo sales to cash buyers.
Condos
| A: Price range $98.9K-$3.5M | S: Price Range $150K-$1.5M |
Active inventory 312
Sold condos 30
Months supply Months 10.4 Months
Average Price $449,379 2024 $347,257
Median Price $370,000 2024 $305,000
Average price per square foot $323.54
Days On Market 81.57
Condos selling under $200K 4
Best selling complex Costa Del Sol (4) $247.5K, $280K, $383K
Single Family Homes
The single family home market in Cocoa Beach & Cape Canaveral has been interesting too. Inventory is up higher than what we have seen in the last few years, but it’s not back to the pre-pandemic inventory levels. It wasn’t uncommon to see 60-70 homes on the market at any given time in 2018-2019. January, our inventory grew to 56 homes on the market in Cocoa Beach & Cape Canaveral. This is the highest level we have seen since March 2020.
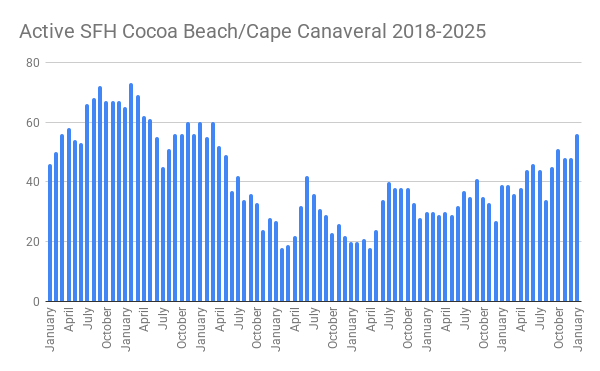
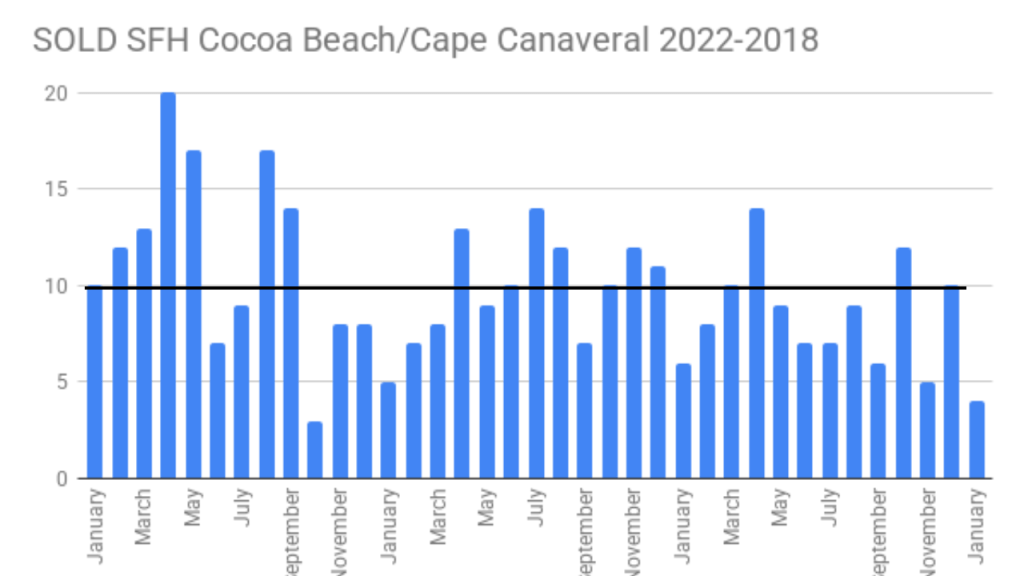
January sales on the other hand were low…we had 4 sales. This isn’t the slowest month though…we had a 3 sale month in October 2022 thanks to hurricanes. Looking back on the last few years, we are averaging 9-10 sales per month. We usually see a few double digits sales per year, but single digit sales for Cocoa Beach/Cape Canaveral are not out of the norm.
I believe the biggest driving factor for home sales and home prices in Cocoa Beach is due to the AirBnB market. You are allowed to do daily rentals in Cocoa Beach and that is attractive to investors.
| A: Price range $545K-$3.498M | S: Price Range $555K-$1.240M |
Active inventory 56
Sold homes 4
Months supply 14
Average Price $840,000 2024 $929,500
Median Price $750,000 2024 $975,000
Average price per square foot $448.50
Days On Market 92
Homes selling under $600K 1
Homes selling over $1M 1
Viera/Suntree Area
The Viera & Suntree area of Brevard is consistently one of the best performing areas of Brevard County. There is a lot of new home construction in Viera West. There’s a lot of commercial development in this area (specifically the 32940 zip) It’s kind of exciting to see everything that is happening in the Viera & Suntree area.
Since I have only started tracking these stats in the last few months, I have limited trends to discuss and point out. Here is what’s going on.
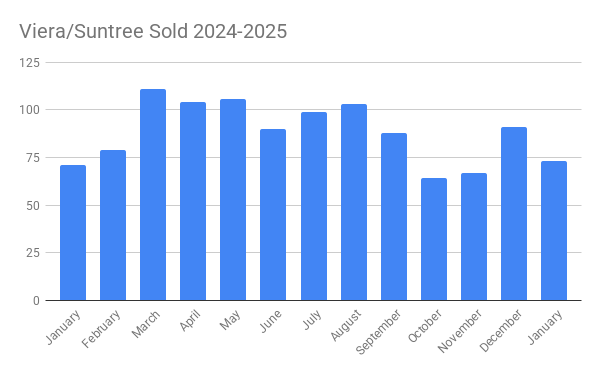
Active inventory is up slightly from the end of summer. There are 276 active single family homes on the market. There were 73 home sales in January that puts our monthly supply at 3.78 months. Under a 4 month supply of homes shows that there is a high demand for living in this area.
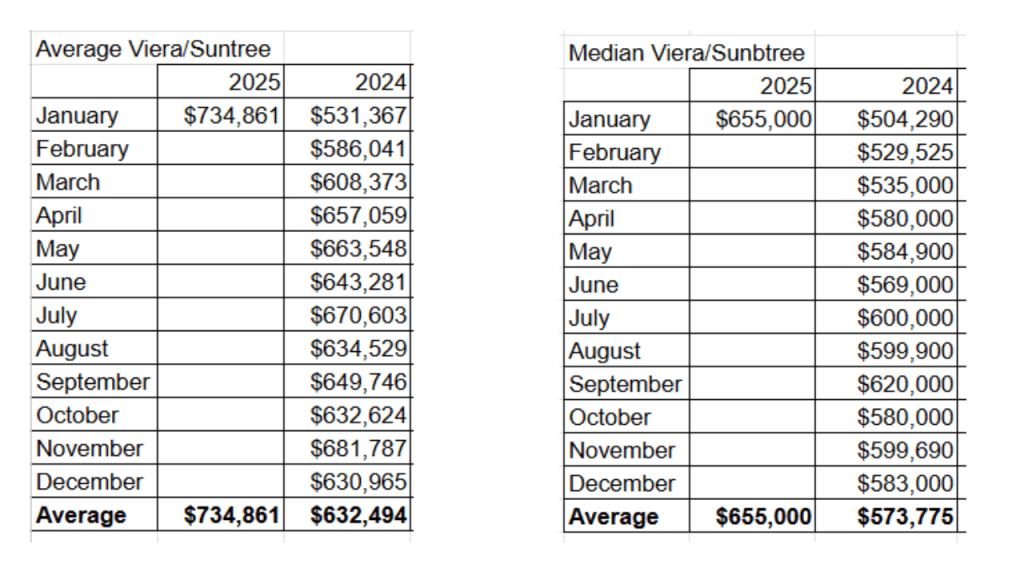
Both Average sales price and median sales price were up over last January. The days on the market of 47.53 days are well under the county average of 75.67 days for January.
Single Family Homes
| A: Price range $304K-$5.250M | S: Price Range $280K-$2.650M |
Active inventory 276
Sold homes 73
Months supply 3.78
Average Price $734,861 2024 $531,367
Median Price $655,000 2024 $504,290
Average price per square foot $278.01
Days On Market 47.53
Homes selling under $500K 21
Homes selling over $1M 10
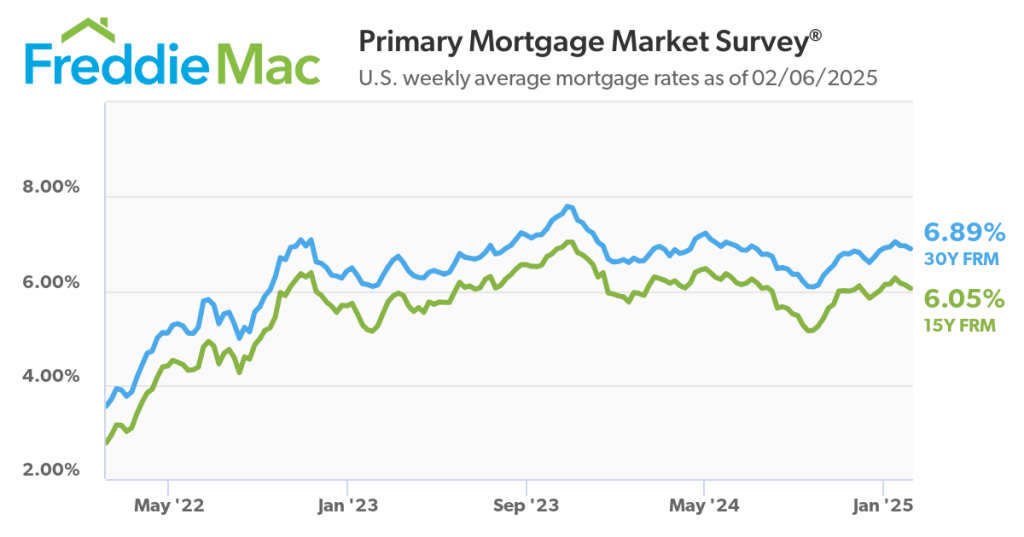
As you can see, many of the real estate trends we saw in 2024 are carrying over into the new year. If interest rates can get back to the 6.25% to 6.5% range (or at least stay under 7%) this could be a better year for our real estate market. Questions about any of this information or an upcoming move? I am here to help!
