Before we get into the May numbers, I want to address something I’ve been seeing a lot lately.
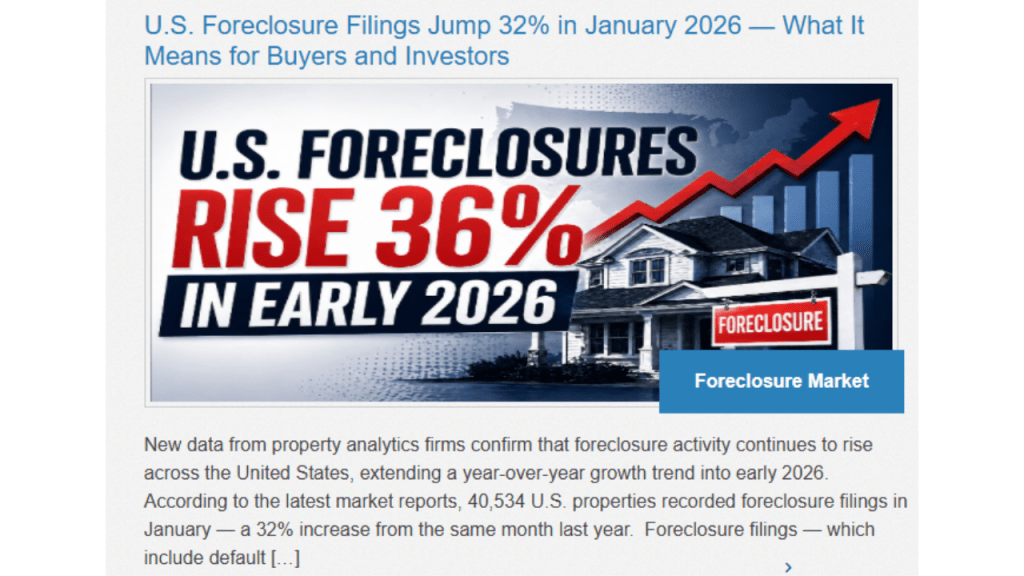
If you’ve been paying attention to the housing market, you’ve probably seen the headlines.
Foreclosures are rising.
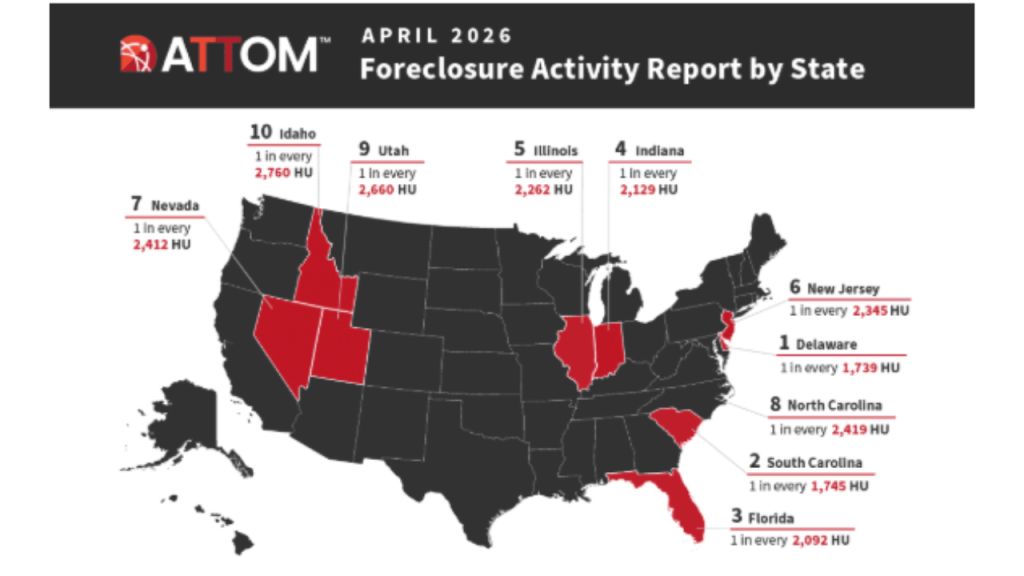
Florida is near the top of the nation for foreclosure activity.
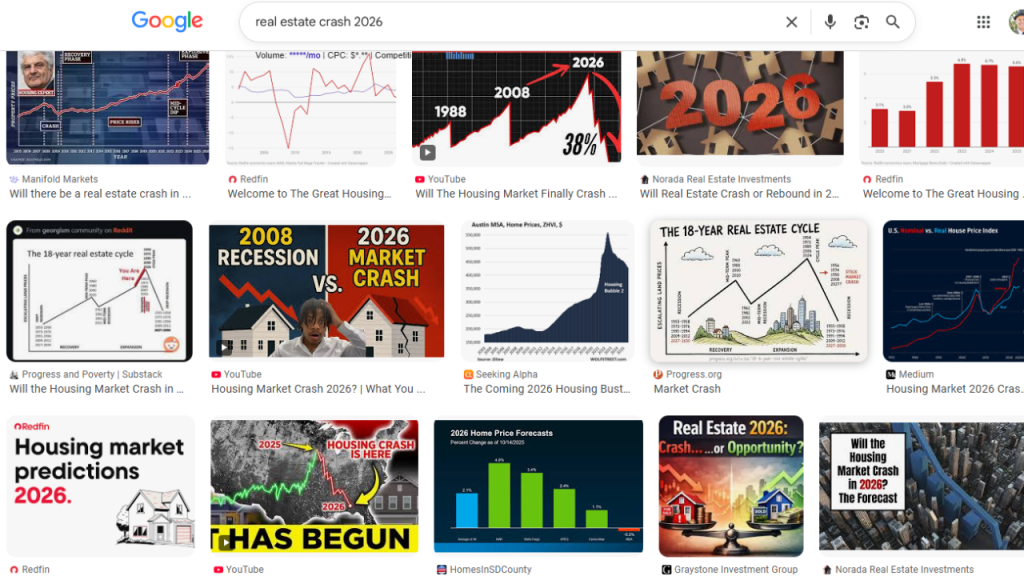
Some articles are even suggesting that a housing crash could be coming.
And while there is some truth behind those headlines, they don’t always tell the whole story. Instead of national trends, Florida trends, or things that are happening in Naples or the Miami market…lets start with what’s actually happening here in Brevard County.
Distressed properties in our MLS, including foreclosures, auctions, and short sales, have increased from 60 listings a year ago to 106 today. That’s about a 75% increase.
At first glance, that sounds pretty significant.
But there are currently 4451 properties for sale in our Space Coast MLS
That means those 106 bank-owned properties represent less than 2.5% of all active listings.
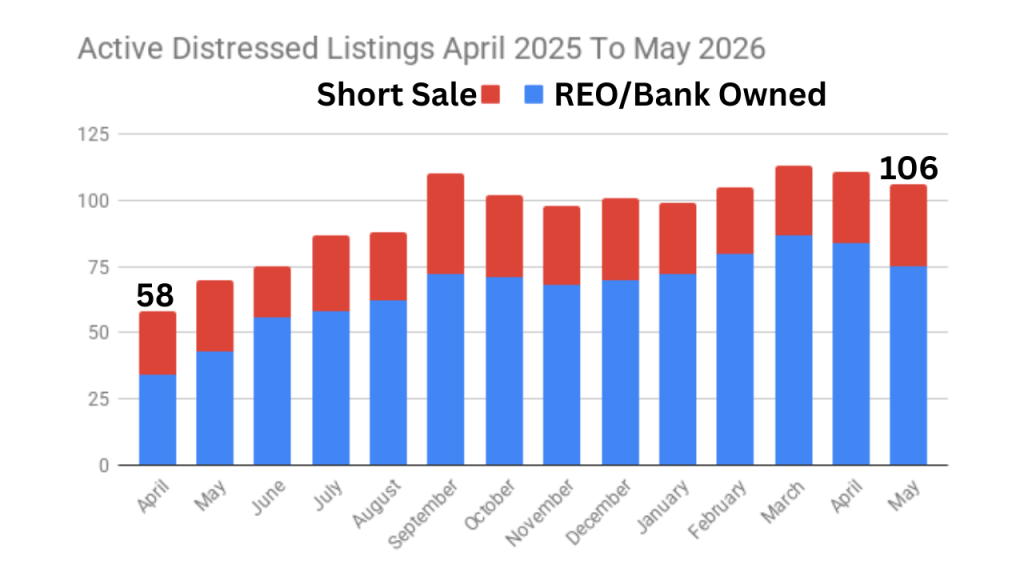
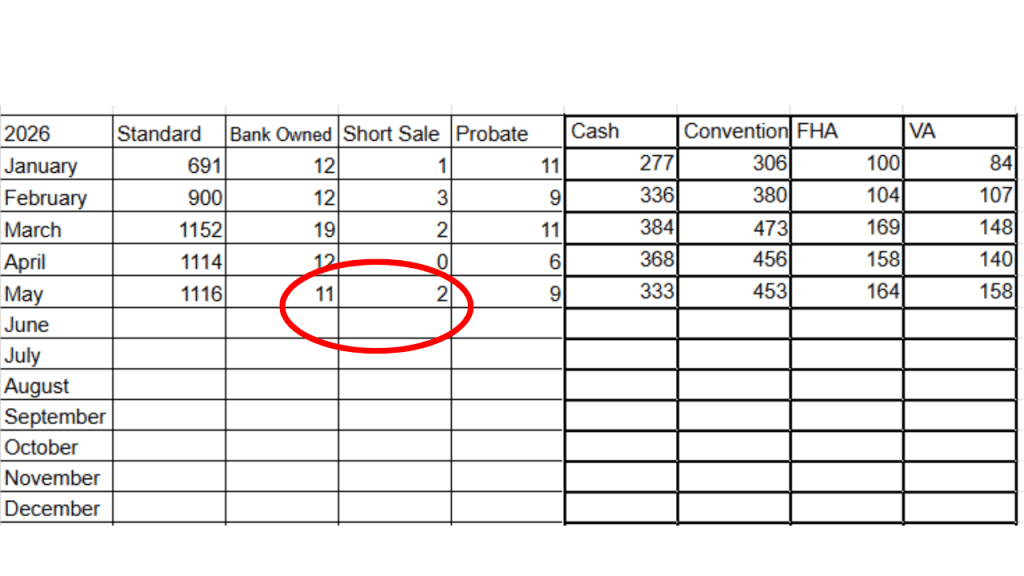
And last month, only 13 distressed properties sell in our MLS.
So yes, foreclosure activity is higher than it was a year ago.
But we’re still talking about a very small part of the overall market.
Now let’s put that into even more perspective.
I’ve been selling real estate here since 2003, which means I lived through the housing crash and the foreclosure crisis that followed.
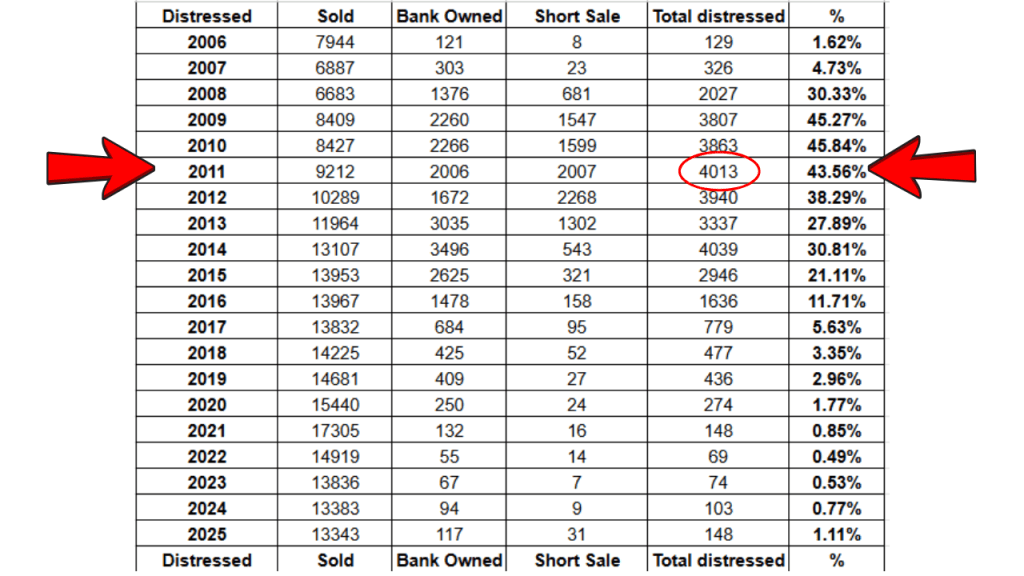
Back in 2011, Brevard County had more than 4,000 distressed sales in a single year.
Foreclosures and short sales accounted for nearly 44% of all transactions.
Think about that for a second.
Almost one out of every two homes that sold was either a foreclosure or a short sale.
Last year?
We had 148 distressed sales.
That’s about 1% of the market.
So while foreclosure activity is definitely increasing from the extremely low levels we’ve seen over the last few years, we’re nowhere close to the conditions that existed during the housing crash.
That doesn’t mean nobody is struggling.
I’ve recently worked with homeowners who had fallen behind on their mortgage payments.
The difference today is that most of them still had equity in their homes.
Instead of losing the property to foreclosure, they were able to sell, pay off what they owed, and walk away with money in their pocket to help start their next chapter.
I’m also currently talking with a couple of homeowners who may need to pursue a short sale, which is something I haven’t seen very often in recent years.
Financial hardship certainly exists.
But today’s market looks very different than it did during the crash because many homeowners have built substantial equity over the past decade.
Brevard County
Active inventory 4451
Sold Property 1156
Months Supply 3.85 months
Average Price $448,386 2025 $423,811
Median Price $365,000 2025 $359,900
List/Sale ratio 92%
Average price per SqFt $234.68 SqFt
Days On Market 72.94 DOM
Property selling in less than 7 days 234 ( 20% of the sales)
Property selling over $1M 50
Highest price sale $4.571M Melbourne Beach
Home sales under $200K 37
So rather than focusing on national headlines, let’s take a look at what actually happened in the Brevard County housing market during May 2026. And what the data shows is a market that’s slower than it was a few years ago, but still far healthier than many of the headlines would have you believe.
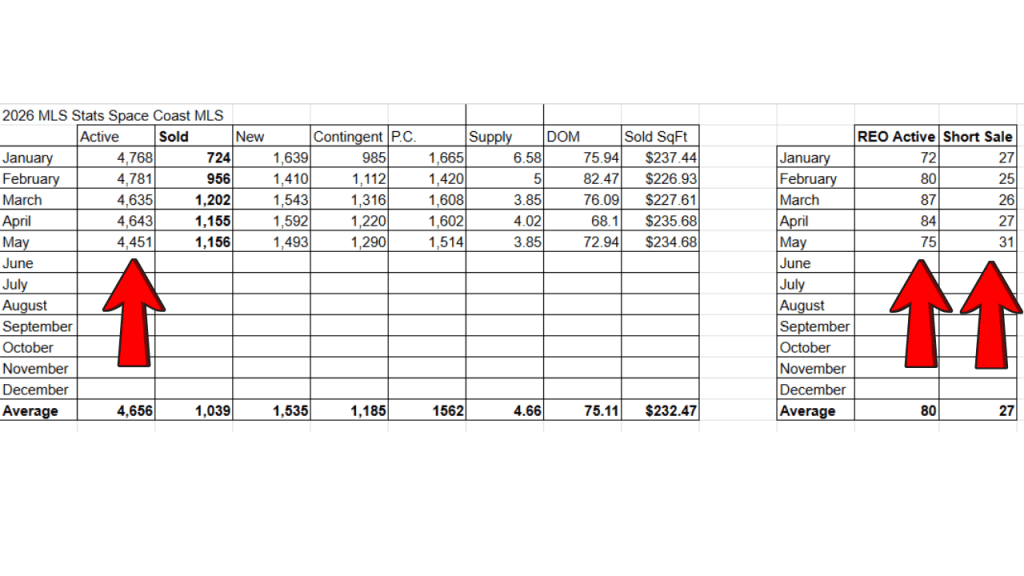
Our active inventory ending May was 4,451 properties in the Space Coast MLS. That’s 18% lower than May 2025.
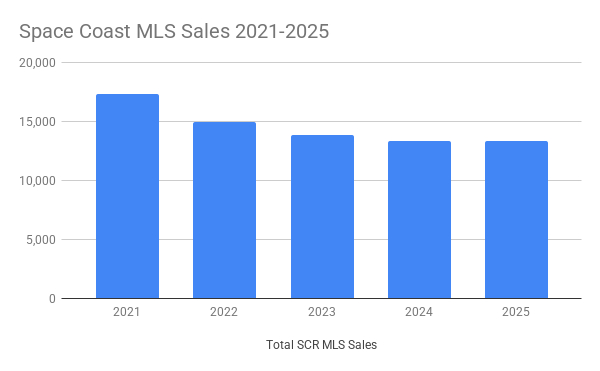
We had 1,156 properties sold in May, which was less than the previous May. Our year to date numbers are trending down from 2025 and if this continues, it will be our 5th consecutive year of declining sales.
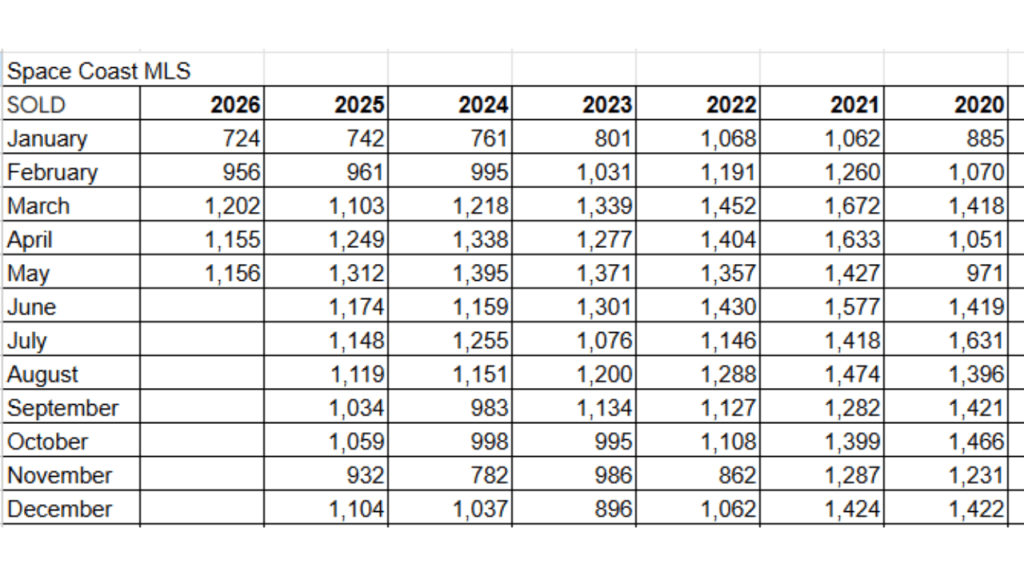
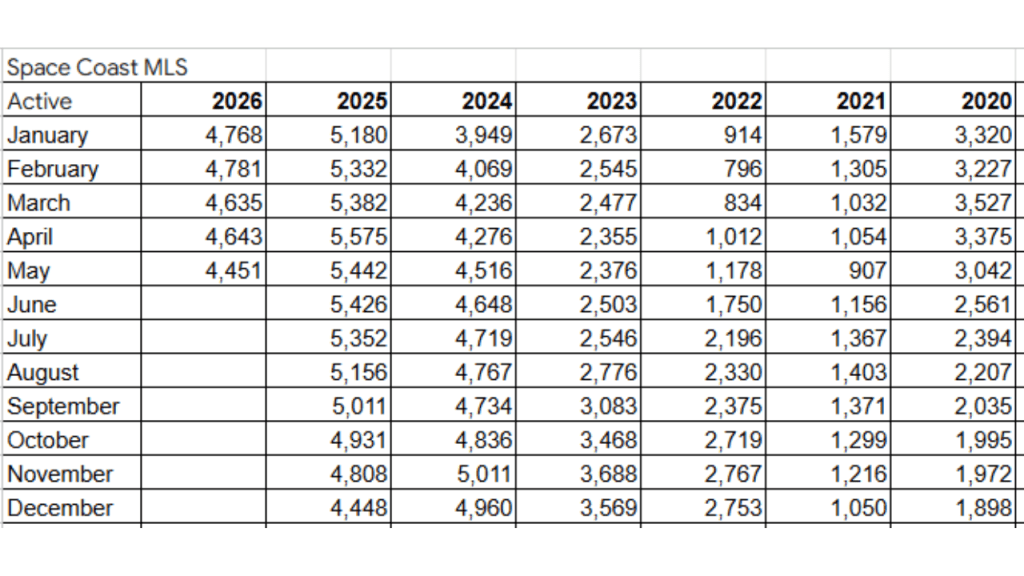
Even though sales are trending behind last year, inventory continues to tighten. We’ve now spent three straight months at or near a four-month supply, which is helping support home prices despite fewer overall sales.
While it is taking more than 70 days on average for a property to sell, 234 homes still sold in seven days or less. That’s about one out of every five sales, which tells me buyers are still moving quickly when the home is priced correctly and shows well.
Another surprise is that the average sales price is up over last May. The median sales price is also up from last May and is actually the highest median price for May when looking back the last few years.
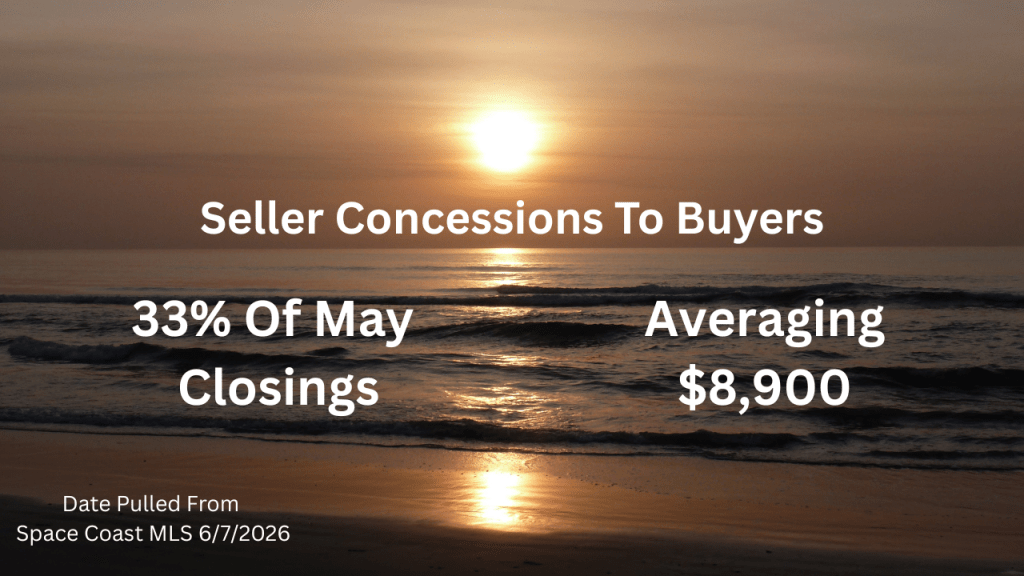
Seller concessions are still a strong part of the market. 33% of the May closings had a Seller concession that averaged $8900.
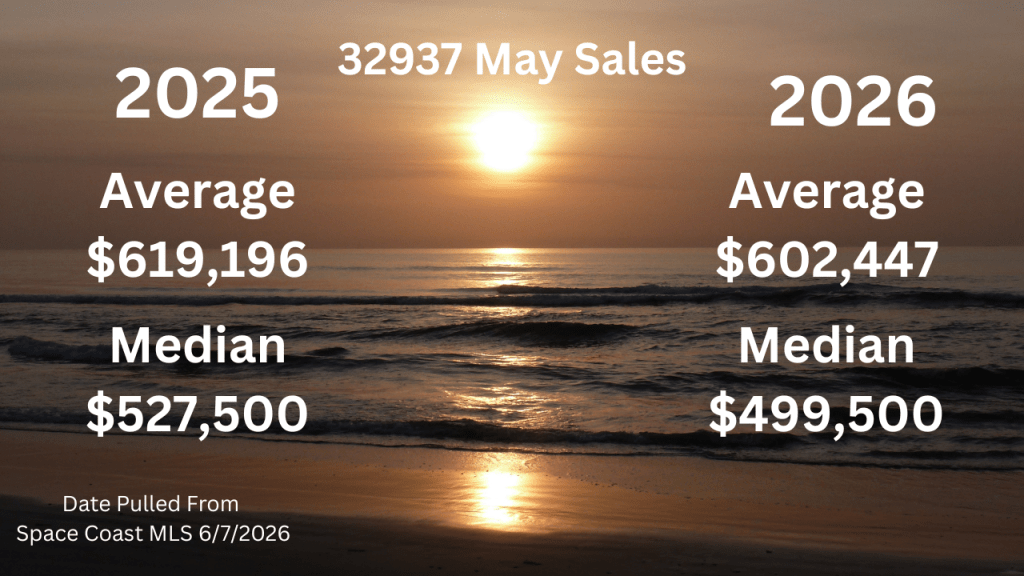
The dominating zip code continues to be the 32940, more on that later in the post. The surprise entering the Top 5 was 32937, which includes Satellite Beach and Indian Harbour Beach. Sales activity held steady compared to last year, but both the median and average sale price were lower. I don’t necessarily view that as a sign that beachside values are falling. With a relatively small number of sales, the mix of properties sold can have a big impact on price statistics. What it does suggest is that buyers have more negotiating power today than they did a few years ago.
Cocoa Beach & Cape Canaveral
Condos
| A: Price range $75K-$1.550M | S: Price Range $85K – $1.2M |
Active inventory 266
Sold condos 52
Months supply 5.12 Months
Average Price $369,432 2025 $394,125
Median Price $314,500 2025 $305,000
Average price per square foot $279.77
Days On Market 99.29 DOM
Condos selling under $200K 14
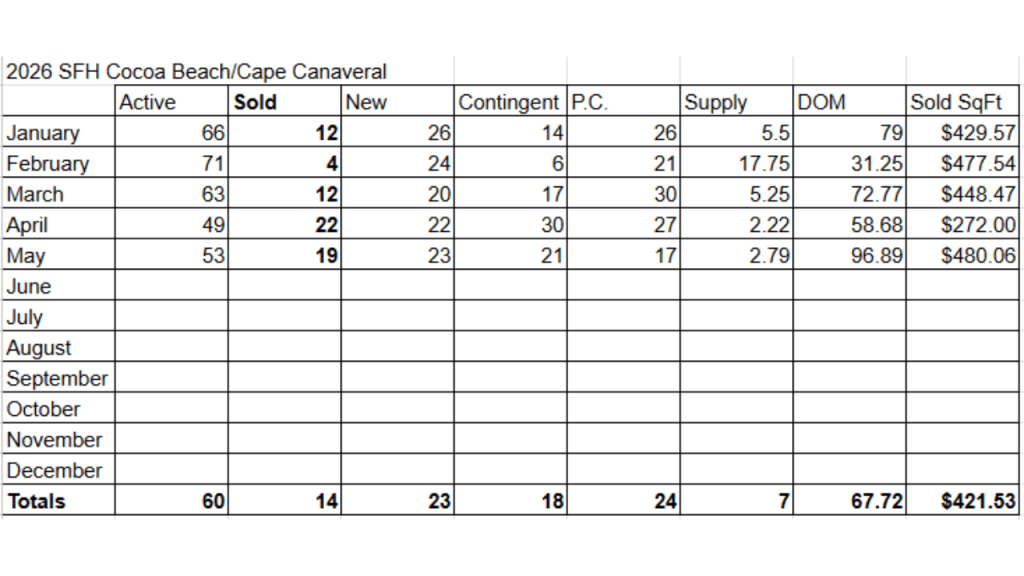
Single Family Homes
| A: Price range $475K – $3.8M | S: Price Range $410K – $3.4M |
Active inventory 53
Sold homes 19
Months supply 2.79 Months
Average Price $1,060,460 2025 $718,678
Median Price $740,000 2025 $720,000
Average price per square foot $480.06 SqFt
Days On Market 96.89 DOM
Homes selling under $600K 6
Homes selling over $1M 6
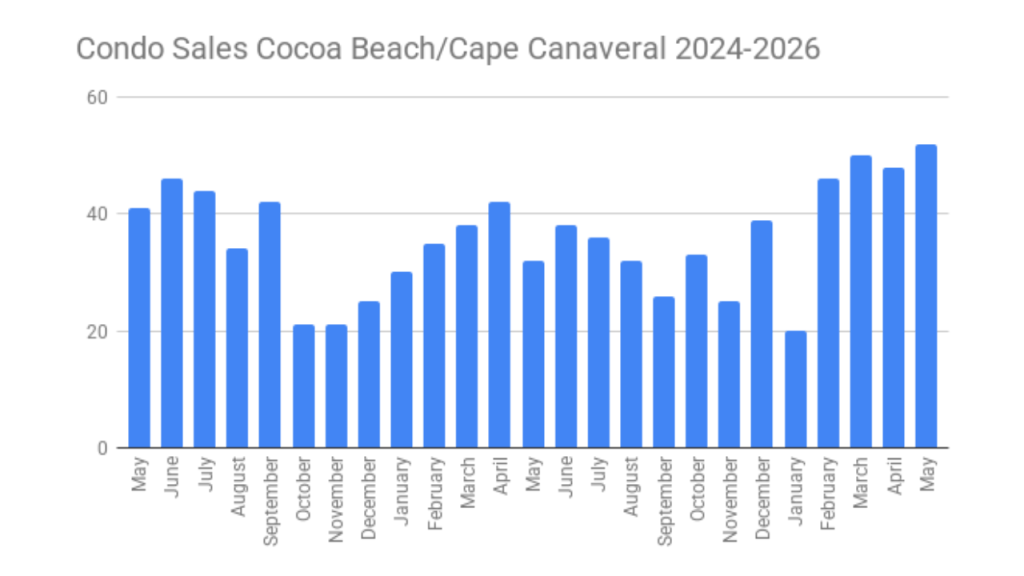
One area that continues to surprise me in 2026 is the beachside market.
Condo sales in Cocoa Beach and Cape Canaveral are the strongest we’ve seen in the last two years.
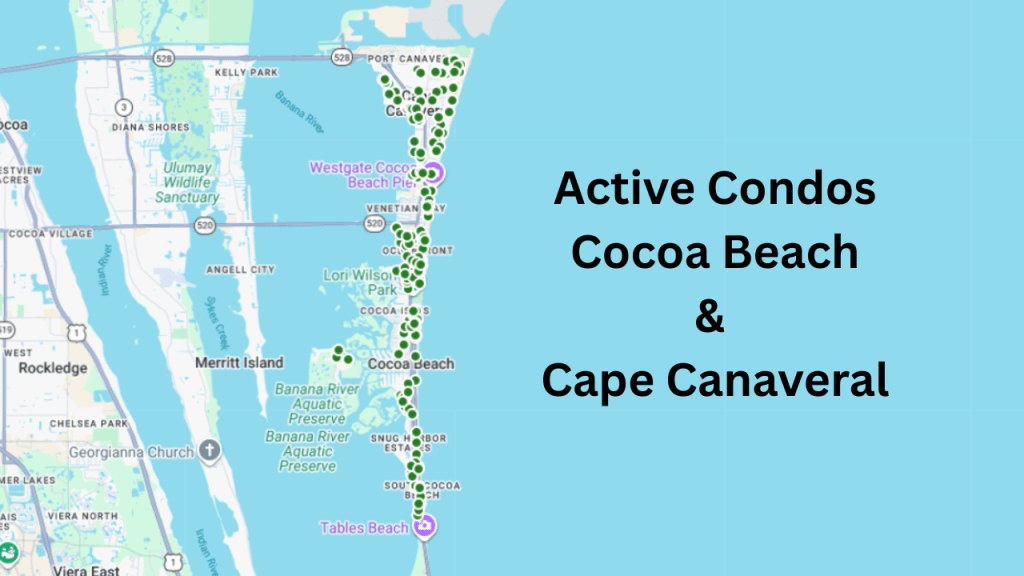
Buyers have more choices than they’ve had in quite some time, with 266 condos currently on the market.
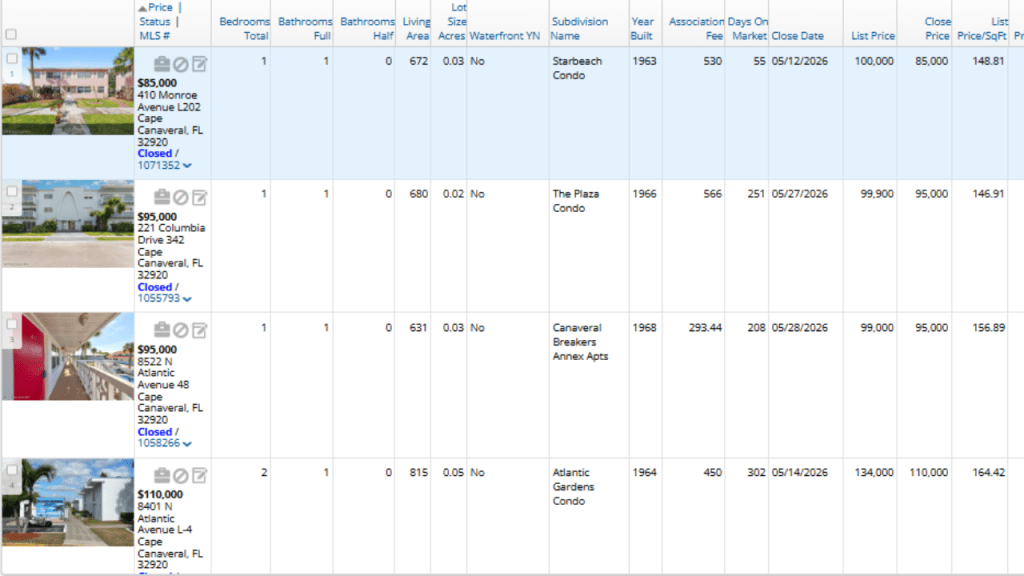
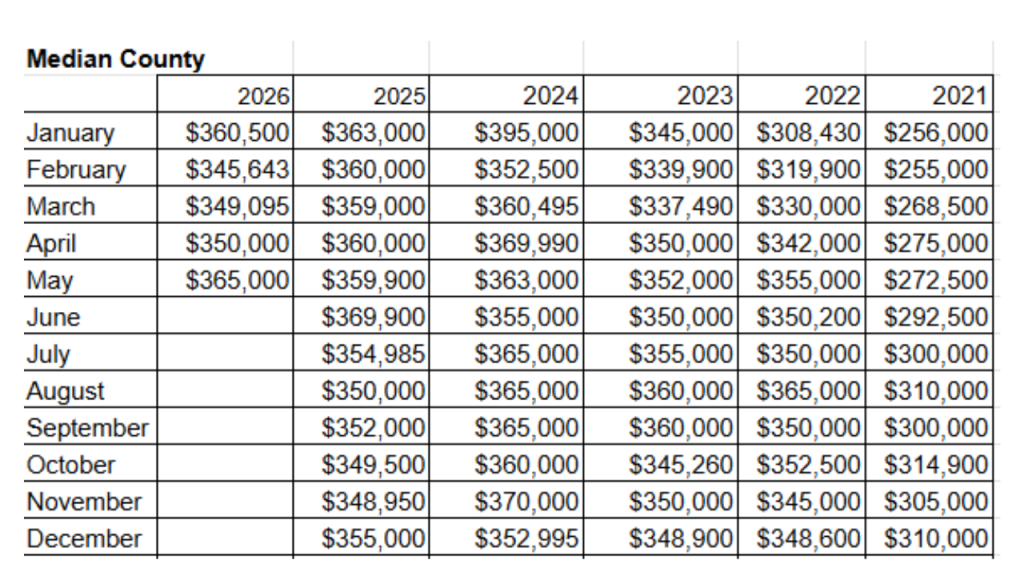
Prices have adjusted as well. The median condo sales price in May was similar to what we were seeing back in 2021, and we’re even seeing some condo sales below $100,000 again.
Could some of that be pent-up demand finally coming back into the market?
It’s certainly possible.
Buyers who may have been waiting on the sidelines now have more inventory to choose from, more negotiating power, and prices that are much closer to where they were a few years ago.
What’s even more impressive is that the strength isn’t limited to condos.
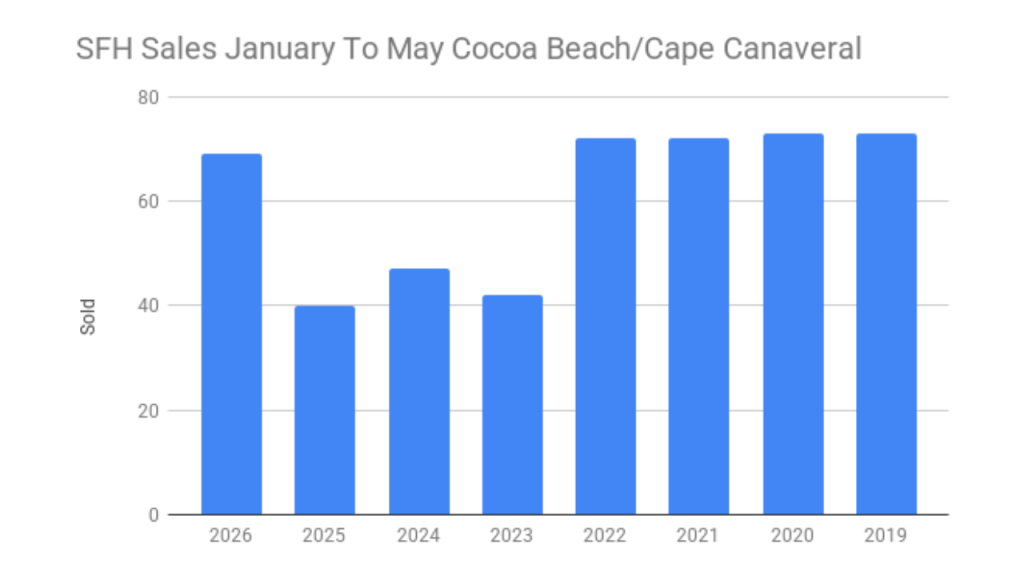
Single-family home sales in Cocoa Beach and Cape Canaveral are also having one of their strongest years outside of the pandemic market.
Nineteen homes sold in May, bringing the year-to-date total to 69 sales.
That’s one of the strongest starts we’ve seen in recent years and another sign that buyers are still willing to pay for the beachside lifestyle when the right property comes on the market.
Viera/Suntree Area
Single Family Homes
| A: Price range $298K – $5.5M | S: Price Range $276K – $2.6M |
Active inventory 231
Sold homes 96
Months supply 2.41 Months
Average Price $685,555 2025 $665,212
Median Price $598,899 2025 $620,000
Average price per square foot $279.41 SqFt
Days On Market 60.31
Homes selling under $500K 33
Homes selling over $1M 10
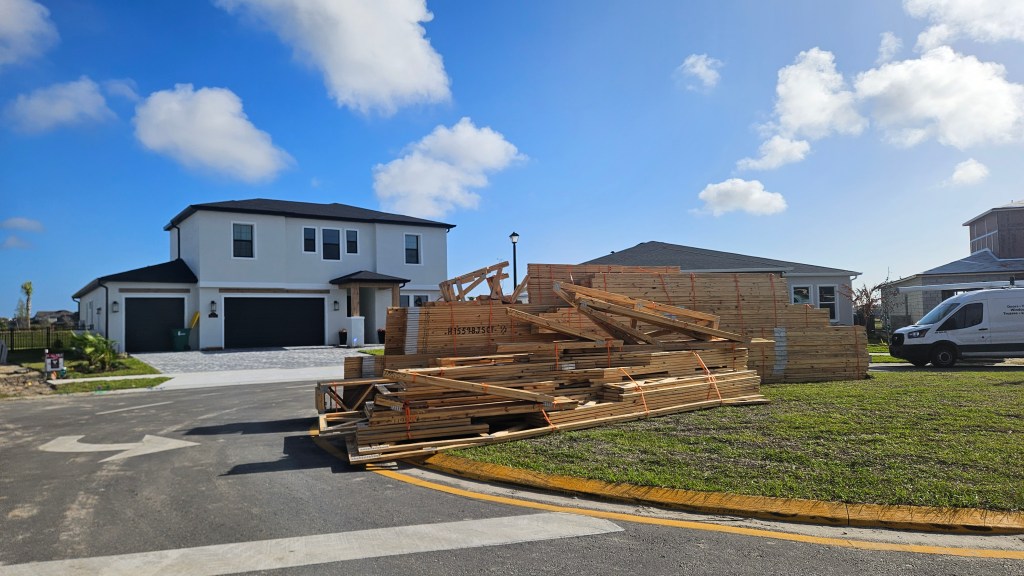
The Viera area continue to be one of the county’s most active housing markets. Of the 127 sales in May, 19 were newly built homes, meaning about 15% of the market came from new construction. While new homes continue to play an important role, most of the activity is still occurring in the resale market.
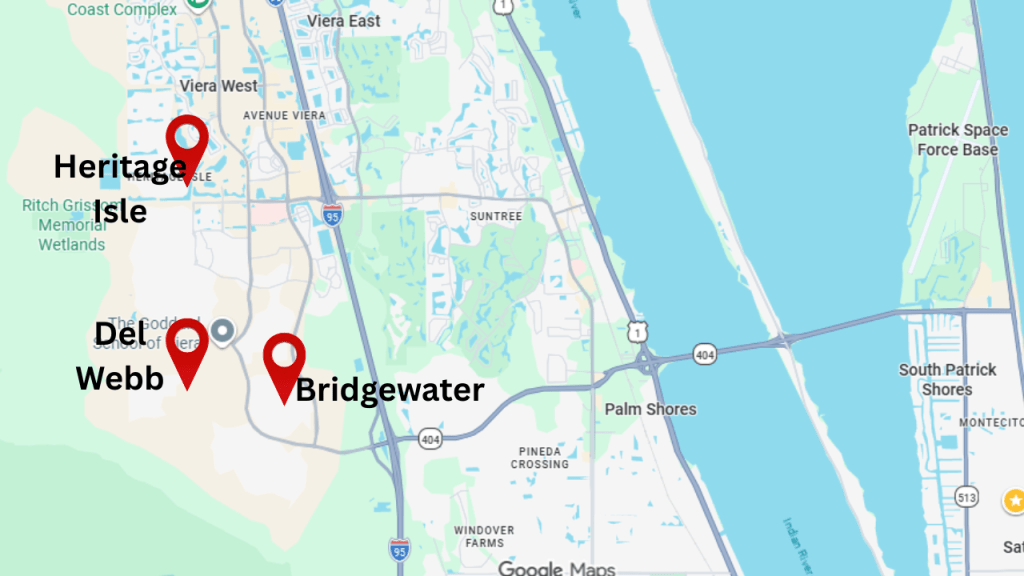
One surprise was the strength of the 55+ communities. Heritage Isle and Del Webb were the two top-selling communities in May, and Bridgewater also made the list of the area’s most active neighborhoods.
While some parts of Brevard County are experiencing more ups and downs, Viera continues to be one of the most consistent housing markets on the Space Coast.
So what is my takeaway from the May numbers?
Despite the headlines about rising foreclosures and concerns about a housing crash, that’s simply not what I’m seeing in the Brevard County data.
Sales remain below last year’s pace, and buyers have more negotiating power than they did a few years ago.
But inventory has been trending lower, prices have remained surprisingly resilient, and demand continues to show up in markets like Cocoa Beach, Cape Canaveral, Satellite Beach, Indian Harbour Beach, and Viera.
The market today feels much more balanced than it did during the frenzy of 2021 and 2022, but it also looks nothing like the housing crash many of us remember from 2008 through 2012.
As always, real estate is local. What’s happening nationally doesn’t always reflect what’s happening here on the Space Coast.
If you’re thinking about buying or selling and want to know what these trends mean for your specific situation, feel free to reach out.
Thanks for watching, and I’ll see you next month with another look at the Brevard County housing market.


Eric Larkin is a Broker Associate with Real Broker, LLC. He lives, works, and plays in the Cocoa Beach area. If you have questions about moving or relocating to Cocoa Beach and the Space Coast, let me know! I get calls, texts, direct messages & comments on my posts every day about the real estate market and things that are happening in Cocoa Beach and the Space Coast that I love answering. Ask me your questions on moving, relocating here, or anything about the community. I am here to help. I have been helping buyers and sellers with their real estate needs since becoming a real estate agent in 2003. My focus is always on helping, answering your questions, and doing everything possible to make certain you have a smooth transaction from beginning to end.
Planning a move or have questions about our area? Eric Larkin with Real Broker, LLC can help! Schedule a call here https://www.ericlarkin.com/schedule-a-call
OR leave your info here and I will call you https://www.ericlarkin.com/contact-form
